

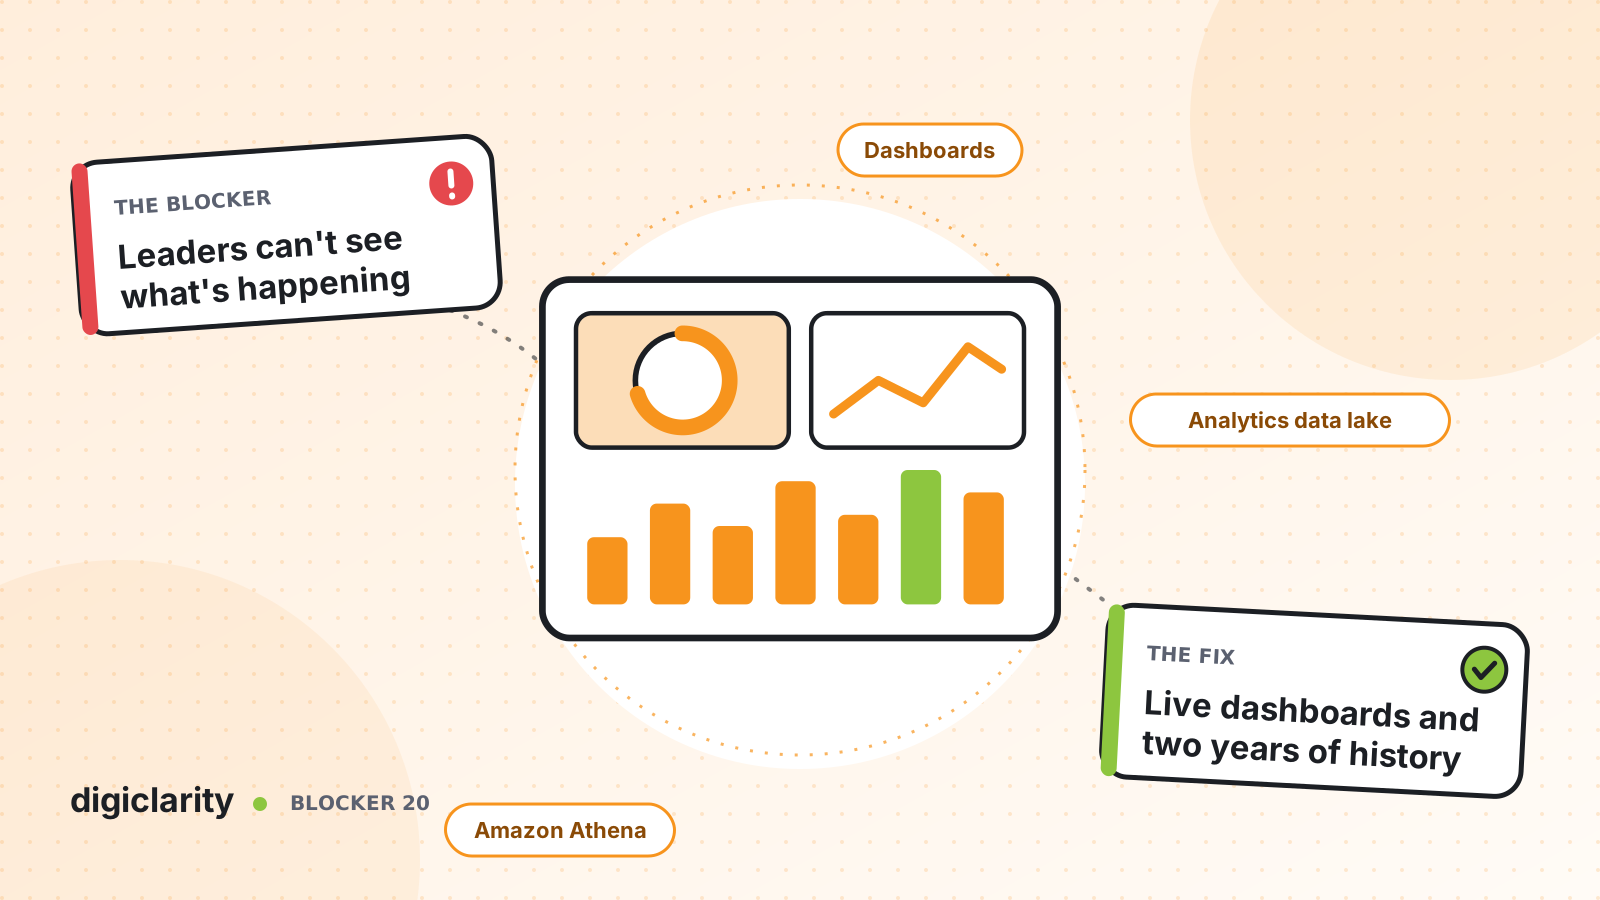
The blocker
The head of customer service asks a simple question: how are we doing right now? The answer takes a day. Someone logs into the platform, exports a few reports, combines them with data from the CRM and sends a spreadsheet. By the time it arrives, the problem it describes is over.
Without a live view, leaders manage by escalation. They hear about long waits from an angry customer or a sales team, not from the system. Without a complete historical view, they cannot answer the questions the business cares about: which call reasons cost the most, which teams resolve issues first time, and whether last quarter’s change made any difference.
Why it happens
- Reports are exports. Data has to be pulled out by hand before anyone can see it.
- Every tool has its own numbers. The telephony platform, the WFM tool and the CRM define metrics differently.
- History is short or locked away. Older systems keep limited history, or charge extra to get it out.
- Nobody is alerted. Thresholds exist on paper, but no one is told when a queue crosses them.
How Amazon Connect solves it
Amazon Connect records every contact and gives you three layers of visibility: live, historical and fully custom.
1. A live view of the floor
In Amazon Connect, each contact produces a contact record, and most real-time and historical metrics are calculated from those records. Contact records stay available in your instance for 24 months.
Real-time metrics reports show agents online, contacts handled and abandoned, and queue activity, with some metrics refreshing every 15 seconds. Dashboards combine real-time and historical data, let you compare against a benchmark period, and can be saved, shared, published to the whole instance or downloaded as PDF or CSV. The Queue and agent performance dashboard brings together service level, contacts handled, handle time, current agent activity and adherence in one place.
2. Alerts instead of escalations
With rules on real-time metrics, Amazon Connect can send an email or create a task for a manager when a condition is met. Examples AWS documents include the number of contacts in a queue, the age of the oldest contact, or agents on break for longer than expected. The right person hears about a problem while there is still time to act.
3. Historical reports that arrive on their own
Historical metrics reports cover past activity, with built-in reports and custom ones you save. You can schedule a report so it is written as a CSV file to your Amazon S3 bucket on a recurring basis. Use the published metric definitions so every team means the same thing by service level or abandonment.
4. The analytics data lake for the questions dashboards can’t answer
The Amazon Connect analytics data lake is a central place to query Amazon Connect data, including contact records, conversational analytics, performance evaluations and more. Data is usually available in less than an hour. You share the tables you need with an AWS account from the Amazon Connect console, with no data pipeline to build.
AWS’s launch post explains that you can analyze this data with Amazon Athena and the business intelligence tool of your choice, such as AWS Quick Sight (formerly Amazon QuickSight). AWS also publishes reference Athena queries for common metrics such as abandonment rate and agent performance. Because the data is in your account, you can join it with CRM, billing or booking data to see cost and outcome by call reason.
One planning point: the data lake keeps a rolling 25-month window that cannot be changed. To keep data longer, AWS recommends copying it to your own Amazon S3 bucket with a scheduled query.
What good looks like
Supervisors watch a live dashboard and get alerts when a queue slips. Managers receive the same scheduled report every Monday without asking. Leaders open one business dashboard that shows volume, service level, cost and outcomes by line of business, built on data the business owns. Meetings start with numbers everyone agrees on, not with arguments about whose spreadsheet is right.
Access follows the organization, too. AWS documents hierarchy-based and tag-based access controls for dashboards and reports, so a team leader sees only the agents and metrics in their part of the agent hierarchy. The same data serves the supervisor on the floor and the executive reviewing the quarter, without separate exports for each.
Where to start
- Agree five to eight headline metrics and their definitions with operations and finance.
- Build and publish one dashboard for supervisors, and set two or three real-time alerts.
- Schedule the weekly historical report to Amazon S3.
- Turn on the analytics data lake for contact and agent tables, and build one business dashboard joined with your CRM data.
- Set up a scheduled export if you need history beyond 25 months.