
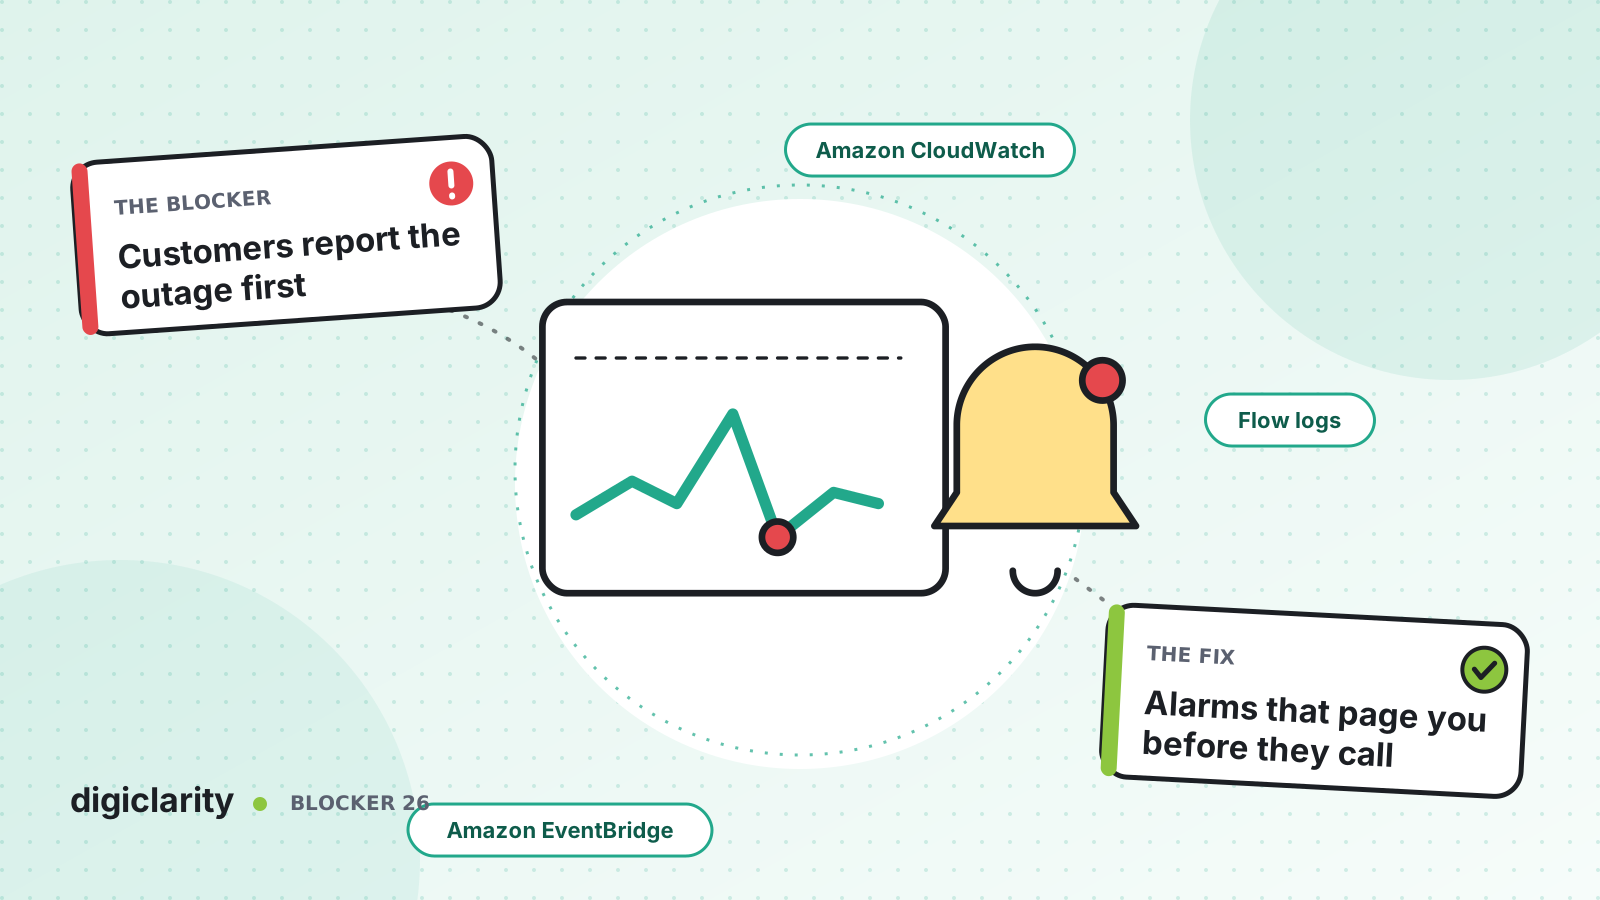
The blocker
At 8:40 a.m. a Lambda function behind the main IVR starts timing out. The flow takes its error branch and plays “we are unable to help you right now” before disconnecting. Nothing turns red anywhere. At 9:30 the social media team forwards a complaint, at 10:00 a supervisor notices the queues are oddly quiet, and by the time someone opens the flow, almost an hour of callers has been turned away.
In many contact centers, monitoring means “is the phone line up?” It is. The problem is inside the flow, and nobody is watching there.
Why it happens
- Only uptime is watched. A line that answers and then fails still looks healthy.
- Flow logging is off. Without flow logs, nobody can see which block a contact failed on.
- Metrics exist but nobody alarms on them. The numbers are in CloudWatch, but no threshold sends anyone a message.
- Changes are not linked to incidents. When something breaks, the team cannot quickly see what changed and when.
How Amazon Connect solves it
1. Use the metrics Amazon Connect already sends
Amazon Connect publishes instance metrics to CloudWatch. Data is sent every minute and kept for two weeks. A few metrics catch most customer-facing failures:
ContactFlowErrors: how many times a flow’s error branch ran. A jump here is often the first sign of a failing integration.ContactFlowFatalErrors: flows that failed to run because of a system error.MisconfiguredPhoneNumbers: calls that failed because the number has no flow.QueueCapacityExceededError: calls rejected because a queue was full.ThrottledCallsandCallsBreachingConcurrencyQuota: calls rejected for exceeding the calls-per-second rate or the concurrent calls quota.ConcurrentCallsPercentage: how much of the concurrent calls quota is in use.LongestQueueWaitTimeandMissedCalls: early signs that customers are waiting too long or agents are not answering.
2. Turn metrics into alarms
CloudWatch alarms watch a metric and send notifications or take actions when it crosses a threshold. Start with alarms on flow errors, fatal errors, rejected calls and quota use. AWS’s quota planning guidance recommends alarms at 80% of quota limits, and requesting an increase when usage stays above that.
Keep the alarms in code alongside the instance, so every environment gets the same coverage.
3. Log every step of your flows
By default, a new instance gets a CloudWatch log group. To capture flow logs, make sure flow logs are enabled for the instance and add a Set logging behavior block to each flow. Logs are only generated for flows that include that block with logging enabled, and a flow that is already published must be published again before it starts logging.
Two details matter. Logging set in one flow carries over to any flow the contact is transferred to. And flow logs are delivered at least once, so a log line can occasionally appear twice. AWS’s routing troubleshooting guide shows how to use the contact record and flow logs together to decide whether a problem is inside Amazon Connect or outside it.
4. React to contact events in near real time
Amazon Connect contact events are a near real-time stream of what happens to each contact, such as queued, connected to an agent or disconnected. They are published to the default Amazon EventBridge event bus, and you subscribe by creating a rule. Use them for operational alerts and dashboards. AWS notes that events are emitted on a best-effort basis and are not ordered, so use their timestamps and design consumers to ignore fields they do not recognize.
5. Know what changed
AWS CloudTrail records Amazon Connect API calls with the caller, time and source IP. When an alarm fires, the first question is often “did someone change something?” CloudTrail answers it, and you can create a trail to keep the events in Amazon S3.
6. Make alerts worth answering
Too many alerts are as bad as none, because people learn to ignore them. Start with a short list tied to customer impact: flow errors, rejected calls, quota use and wait times. Give each alarm an owner, a severity and a runbook that says what to check first. Review every alert after an incident. If it did not lead to action, tune it or remove it. Build the alarms, dashboards and EventBridge rules from the same code as the instance, so a new flow or queue is monitored from its first day.
What good looks like
The on-call engineer gets an alert a few minutes after flow errors start climbing, with a link to the dashboard and a runbook. Flow logs show the failing block. CloudTrail shows a Lambda change deployed twenty minutes earlier. The change is rolled back before most customers notice. Contact center leaders hear about the incident from the operations team, not from customers.
Where to start
- Enable flow logs on the instance and add Set logging behavior blocks to your main flows.
- Create CloudWatch alarms on
ContactFlowErrors,ContactFlowFatalErrors,ThrottledCallsandConcurrentCallsPercentage. - Send alarms to a channel someone watches 24x7, each with a short runbook.
- Add an EventBridge rule for contact events and confirm a CloudTrail trail is capturing Amazon Connect API calls.