

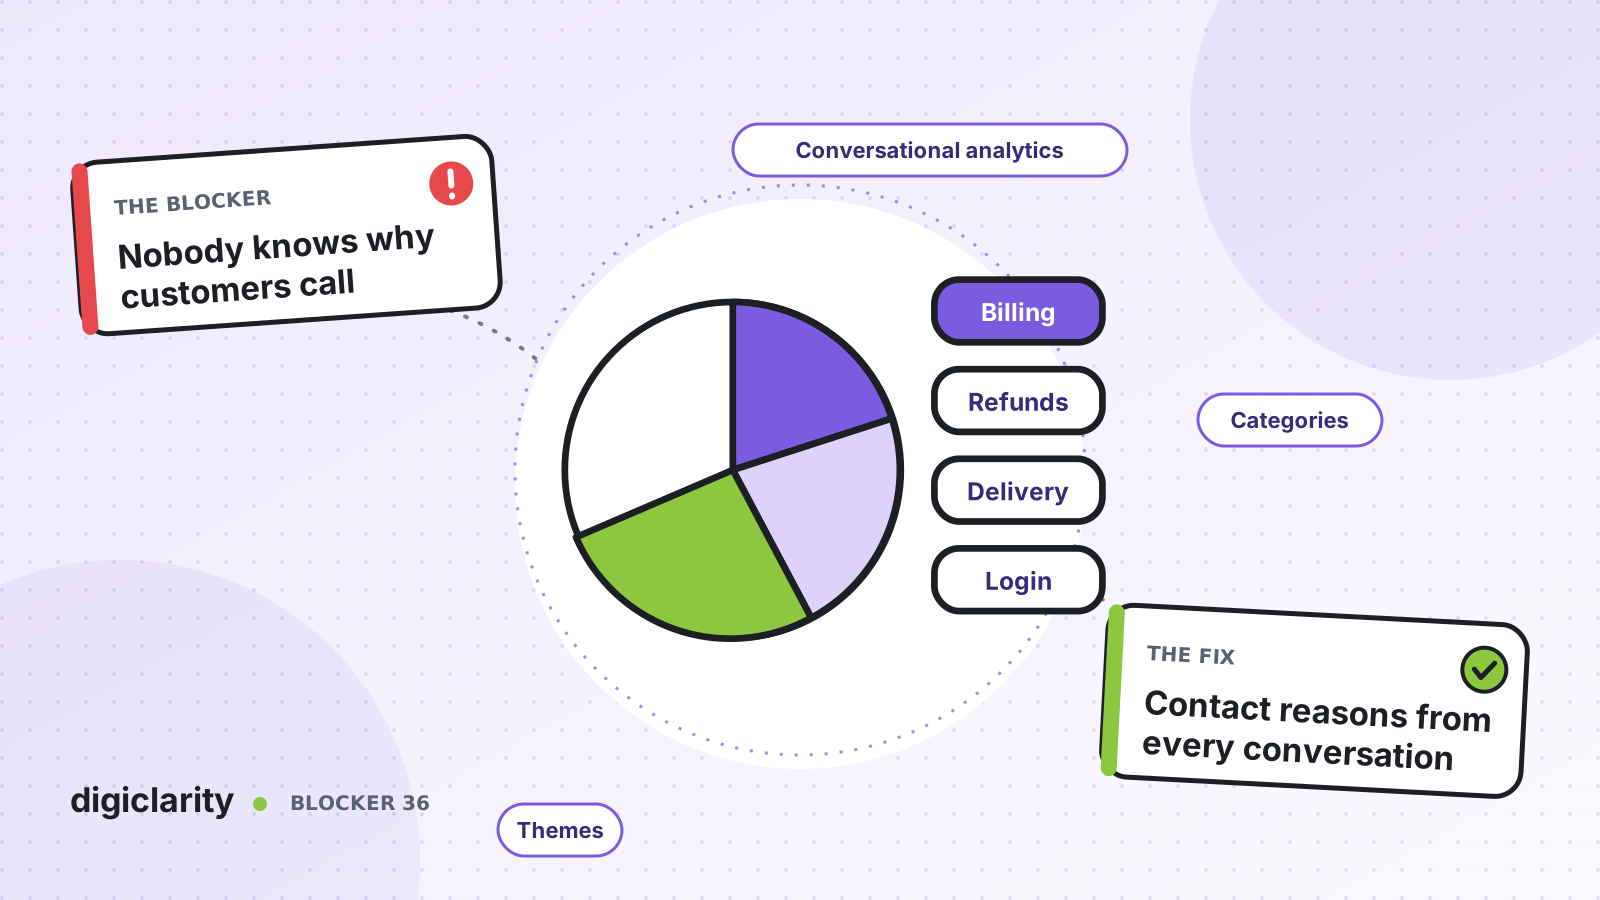
The blocker
Ask a contact center leader why customers call, and you usually get one of two answers. The first is a list of IVR menu options. The second is a pie chart of disposition codes that agents picked after each call. Neither is reliable.
Callers press whatever option gets them to a person fastest. Agents pick the first code that is close enough, often from a long dropdown, while the next contact is already ringing. A call coded “billing” might really be about a confusing letter, a failed online payment or a delivery that never arrived. The real reasons stay hidden in recordings and chat transcripts that nobody has time to read.
So the business cannot fix the causes. The same calls come in every week, the website and the IVR never change, and the contact center gets blamed for volume it did not create.
Why it happens
- Reasons are self-reported. IVR choices and disposition codes depend on what callers press and what agents remember to select.
- The list of codes is fixed. A new problem, such as a bug in the app, has no code until someone notices it and adds one.
- Nobody reads the conversations. The evidence is in thousands of transcripts, but manual review covers a tiny sample.
- Reasons are not linked to cost. Even when you know a reason, you rarely know its handle time or how fast it is growing.
How Amazon Connect solves it
Amazon Connect conversational analytics analyzes the conversation itself. AWS describes it as a way to understand sentiment, conversation characteristics and emerging contact themes. It works across voice, chat and email, and for both agent conversations and self-service.
1. Turn on analytics for the contacts you care about
You enable conversational analytics in the flow with the Set recording, analytics and processing behavior block. You choose the channel, the language and options such as redaction and contact summaries. Analytics only covers the contacts that pass through that block, so check every inbound and transfer flow.
2. Discover reasons you did not know about
Theme detection groups contacts with similar issues and labels the themes, such as “cancel reservation” or “delayed order”. You do not tell it what to look for. You build a saved search in Contact search, and choose Generate themes report.
A few rules apply. The saved search must contain at least 300 contacts with issues detected by conversational analytics. Each report covers the 3,000 most recent contacts, and reports are deleted after 30 days. Theme detection currently supports English locales only. Users need the theme detection permissions in their security profile.
Choose a theme label to see its contacts, play the recordings and read the transcripts. This is where you find the cause behind the volume.
3. Label every contact with category rules
Themes tell you what to look for. Contact categories label every new contact from then on. You create a conversational analytics rule and choose how it matches:
- Exact match or pattern match on words and phrases. Pattern match can, for example, find “credit” when it is not next to “card”.
- Natural language semantic match, which uses generative AI to answer a yes or no question about the conversation, such as “The customer wanted to make a change to their subscription plan.” It needs the Rules - Generative AI permission and does not work for real-time analysis.
You can narrow a rule by queue, contact attributes or sentiment score. A rule can also act: it can create a task or a case, send an email or in-app notification, or generate an Amazon EventBridge event.
Rules apply only to contacts analyzed after the rule is added. AWS notes that you cannot apply them to past conversations, so create your core categories early.
4. Report on contact drivers over time
The conversational analytics dashboard answers three questions AWS lists directly: why customers are contacting you, how those drivers trend over time, and how each driver performs. For each category it shows the share of analyzed contacts, average handle time, average queue answer time and contacts transferred in. Movers and shakers shows the categories that changed most against a benchmark period, such as last week. Choose a category to open Contact search filtered to those contacts.
For reports that join contact reasons with your own data, the analytics data lake includes a conversational analytics table with the categories assigned to each contact. Joining that with your order, billing or CRM data is something you build.
What good looks like
Every contact carries labels based on what was said, not on what was pressed. Each month, the team generates theme reports to look for new problems, and turns the ones that matter into categories. Leaders see the top contact drivers, their handle time and which ones are growing. Product, billing and digital teams get a short list of causes to fix, with transcripts as evidence. When they fix one, the category shows whether the volume falls.
Where to start
- Enable conversational analytics in the flows for your largest queues, and check that transfers keep it on.
- After a few weeks, save a search of recent contacts with detected issues and generate a theme report.
- Turn the top five themes into category rules, using natural language semantic match where wording varies.
- Review the conversational analytics dashboard every week, and share the biggest movers with the teams that own the cause.